Introduction #
Who are APQC? #
The APQC have been around for nearly 50 years (approx. 45 years). APQC was founded in 1977 as the American Productivity Centre (APC) to improve productivity in the US. Over time, its name was changed to the American Productivity & Quality Center and then simply APQC.
While the APQC is known as a source for resources on productivity, quality, improvement methodologies, training and advisory services, it is now best known for their Process Classification Framework and Benchmarking.
The APQC is a member-based organization but has made the PCF available to non-members after registration. Participation in Benchmarking initiatives is only available to member organizations.
Other than their PCF and Benchmark library, APQC has an extensive library of Resources, including articles, infographics, reports, training materials, and whitepapers. The majority of these resources are restricted to members, but many resources are generally available.
APQC’s Process Classification Framework #
The PCF is one of the APQC’s best known publications and underpins much of their Intellectual Property. It has multiple uses, but the typical uses of the PCF are:
- As a starting inventory for identifying processes as part process identification or a process documentation initiative
- As an information source for scoping of business processes, including performance measures
- As the foundation for conducting Benchmarking activities.
The PCF allows organizations to be able to compare the performance of their processes regardless of their size and (for management and support processes) their industry versions. Using the APQC benchmarking library, organizations within the same or similar industries can also benchmark their operational processes.
As well as a Cross-Industry version of the PCF, APQC also publishes 19 industry specific PCF versions.
What is the PCF? #
Overview #
The first version of the PCF was developed in 1992 and is now the most widely used process framework, globally.
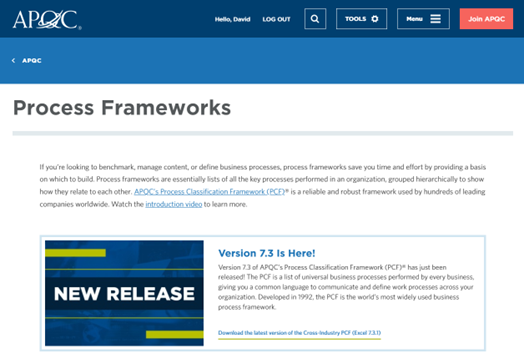
Figure 1: APQC Process Classification Home page
As show above, APQC’s Cross-Industry PCF most recent release is version 7.3 and was published in May 2022. Each version of the PCF, is now published in two formats, a Microsoft Excel workbook and PDF formats.
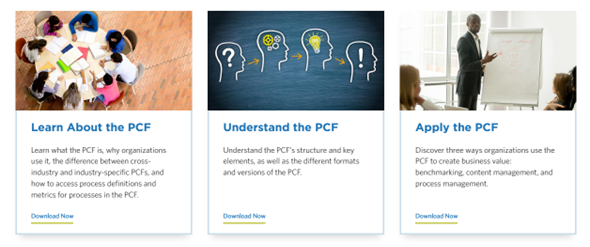
Figure 2: Introducing PCF
In their document Introduction to APQC’s Process Classification Framework®, the article outlines:
- What the PCF is
- Why organizations use the PCF
- The difference between cross-industry and industry-specific PCFs
- How to access process definitions and metrics for processes in the PCF.
What is the PCF is #
The PCF is a hierarchical list of business processes. It includes 13 high-level Categories of work, each of which breaks down that work into increasingly granular units or levels called Process Group, Process, Activity, and Task. Figure 3 displays the five levels of the PCF with examples from Category 4.0 of the PCF.
The numbers in red are called process element identification numbers. Each process element in the PCF has a unique identification number. This allows for benchmarking even when process element names and definitions change across industries and organizations.
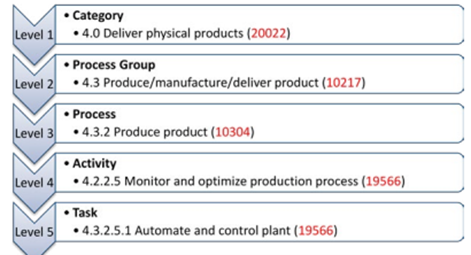
Figure 3: PCF Levels with Examples
The numbers in front of the process element name (e.g., “4.3.1”) are called “hierarchy numbers.” With these numbers, you can easily locate a single process element by following the hierarchy. The numbers in red are called process element identification numbers. Each process element in the PCF has a unique identification number. This allows for benchmarking even when process element names and definitions change across industries and organizations. Whereas if you wanted to find a process element via a process element identification number, you would have to scan all of the possible process elements in order to find one you’re looking for.
Note: The PCF is not consistently leveled. This means that process elements at the task level in one activity may require a different amount of effort to perform than tasks in another activity at a different point in the framework. Some tasks may further be subdivided into sub-tasks.
The PCF is not a visual representation of the flow of work throughout an organization. It is not a process map, a flow chart, or a swim lane diagram. The PCF can be used to create those models, but a PCF by itself
lacks the additional information traditionally contained within diagrams like these.
Why organizations use the PCF #
There are three reasons why organizations typically adopt use of the PCF:
- Process Definition and Management
- Benchmarking
- Content Management
Process Definition and Management #
Defining processes helps organizations standardize processes and identify improvement opportunities. The PCF provides a baseline for organizations to develop their own process definitions.
Furthermore, the PCF provides a firm basis for enterprise-wide modeling efforts. The PCF provides a consistent language to bring all models together, and that language maps directly to the way that
work is performed within the organization.
This reduces the effort needed to develop and manage a variety of enterprise models.
Benchmarking #
If you want to compare performance across your organization or against other companies, you need to have a clear definition of what you want to compare. The PCF provides a way to objectively benchmark within an organization and against other companies. The process elements’ unique reference numbers allow organizations to benchmark even when their process definitions and details differ due to industry or the unique needs of the business.
Content Management #
Especially in global and complex organizations, content needs to be organized so people can find what they need and work together. Organizations use the PCF as a framework for organizing content by process.
Cross-Industry versus Industry-Specific PCF
PCF Structure and Key Elements #
PCF Levels and Structure #
The PCF is a hierarchical framework of business processes, which starts with Process Categories at the top of the hierarchy. These Process Categories are broken down into increasingly levels of detail:
- Level 1 – Process Category: is the highest level of the process framework.
- Level 2 – Process Group: indicates a group of processes that are part of executing a Category.
- Level 3 – Process: is a single process; it is the name for a series of steps required to achieve a particular result.
- Level 4 – Activity: is a key step performed to execute a process. Task is an element of work that goes into executing an activity.
- Level 5 – Tasks: are the most fine-grained elements of the PCF, and they often vary among industries and organizations.
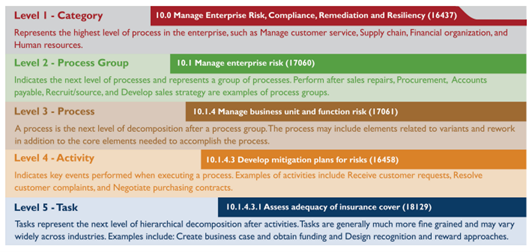
Figure 4: APQC PCF Levels as documented in Version 7.3.0
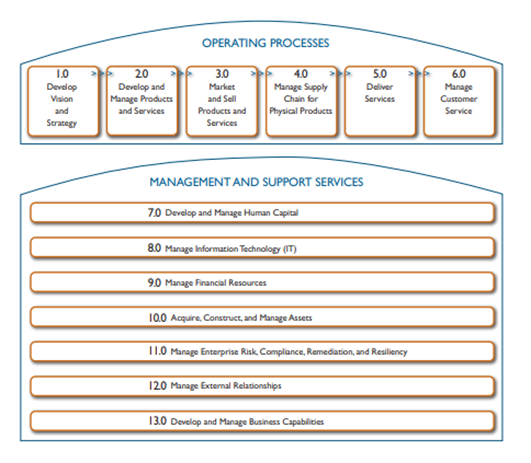
Figure 5: APQC PCF Process Categories in Version 7.3.0
As indicated previously, the PCF is published in PDF and Microsoft Excel formats. The PDF document is a useful format to enable an easy to read and browse through the PCF:
- The first page contains:
- A short overview of the PCF, including a graphic showing the Process Categories
- A outline of how the PCF can be used as a framework for process improvement
- A short history of the PCF.
- The second page contains:
- Short description of the APQC , copyright information and the future of the PCF
- A table of contents to the remainder of the Document.
- The third page contains:
- A graphic short overview of the PCF, including a graphic showing the Process Categories
- An explanation of the Process Element Numbering Scheme.
- The fourth and further pages contain:
- Process Groups, Processes, Activities and Tasks within each Process Category, which are shown as tabs
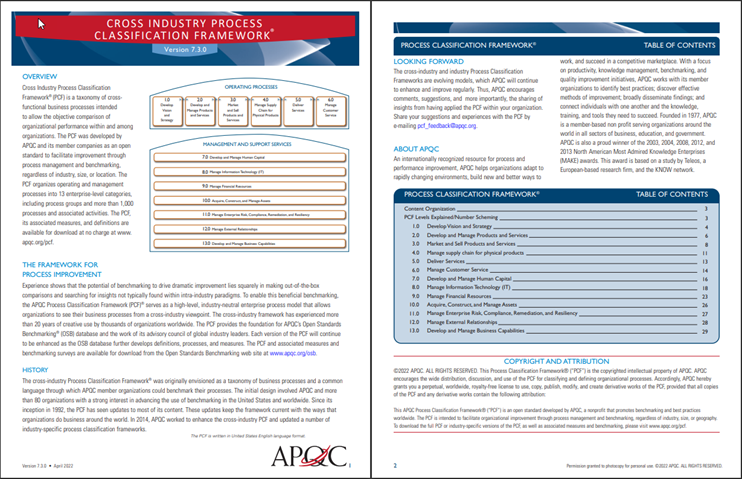
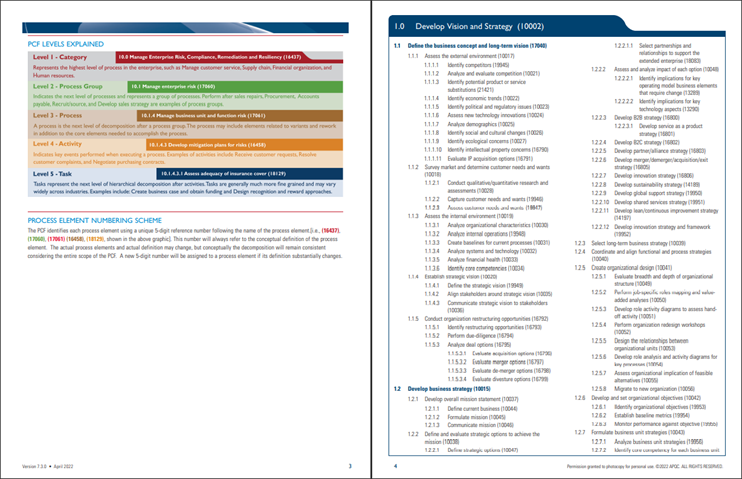
Figure 6: Pages 1 through 4 of APQC’s Cross-Industry PCF Version 7.3.0 (PDF Version)
In addition to the main PCF PDF document, a set of additional PDF documents provide the Definition and Key Measures for the PCF, one for each Process Category. Each Definition and Key Measures PDF document uses the same layout and format:
- The first page contains:
- A graphic showing the selected Process Category and where it fits within the PCF
- A short history of the PCF and how it can be used as a process improvement framework
- A short history of the PCF.
- The second page contains:
- Short description of the APQC , copyright information and the future of the PCF
- A table of contents to the remainder of the Document.
- The third and further page contains:
- The description of the Definition Process Classification
- The Key Performance Indicators and Process Insights
- Definitions for the Process Groups, Processes, Activities and Tasks.
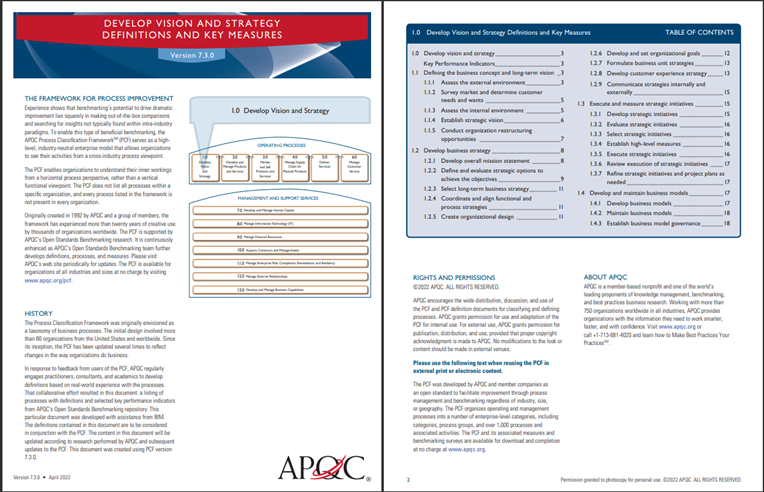
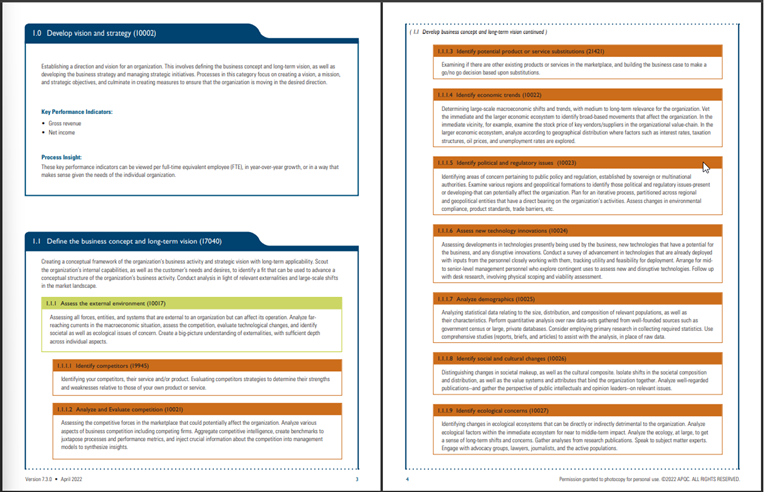
Figure 7: Pages 1 through 4 of Definitions and Key Measures for 1.0 Develop vision and strategy
The Microsoft Excel workbook version of the PCF is delivered in 20 individual worksheets, which contain:
- A worksheet called Introduction, which is cover page
- A worksheet called About, which provides an outline of the key contents and attributes of the workbook
- A worksheet called Process Categories with a list of Process Categories and their key attributes
- One worksheet labelled with the Hierarchy ID for each Process Category with the details of the Process Groups, Processes, Activities and Tasks for each Process Category
- A worksheet called Combined, which consolidates the individual Process Categories worksheets into a single table
- A worksheet called Glossary terms, which contains the definitions for each Process Category, Process Groups, Processes, Activities and Tasks
- A worksheet called Metrics, which contains the details of the key performance indicators, including the category of measure, name of measure and the measure’s formula
- A worksheet called Copyright and attribution, which includes an outline of the APQC and details of the PCF copyright and attribution.
The details contained in many of the worksheets within the workbook can be used to populate information in EPC. For example, the Combined worksheet can be used to populate the Process inventory.
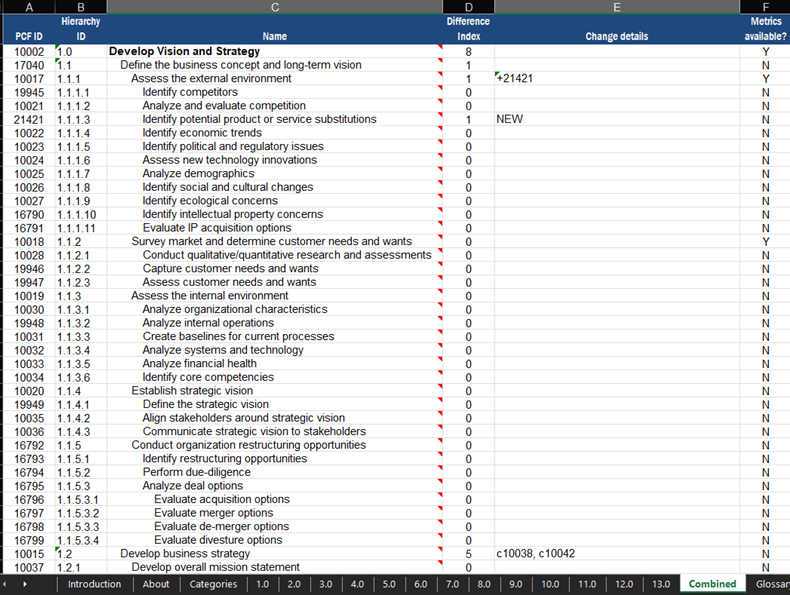
Figure 8: Screen capture of Combined Worksheet
To build on to the Processes created from the Combined worksheet, the Glossary terms worksheet can be used to populate the description of each of the processes.

Figure 9: Screen capture of Glossary terms worksheet
The Metrics worksheet can be used to populate Key Performance Indicators. However these need to be linked to objectives, which may need to be created manually.
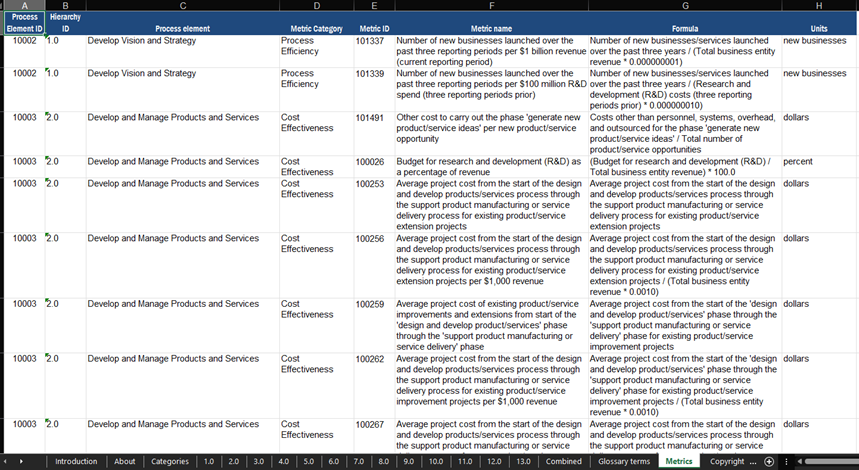
Figure 10: Screen capture of Metrics worksheet
As well as a Cross-Industry version of the PCF, APQC publishes 19 industry specific PCF versions for:
- Aerospace and Defense
- Airline
- Automotive
- Banking
- Broadcasting
- City Government
- Consumer Electronics
- Consumer Products
- Corrosion
- Downstream Petroleum
- Education
- Healthcare Provider
- Health Insurance Payor
- Life Sciences
- Property and Casualty Insurance
- Retail
- Telecommunications
- Upstream Petroleum
Although the APQC has developed these Industry-Specific versions of the PCF over some time, it should be recognized and understood that they trail the versions of the Cross-Industry. Most of the Industry-Specific versions of the PCF are aligned to the prior of the PCF, which is 7.2.1. However, there are some variances. For example, the APQC has:
- Not updated the Telecommunications version of the PCF since version 5.0.2, which was published November 2008.
- Created new simpler versions of the PCF for both Banking and Property and Casualty Insurance in December 2019, each of which have been given the version 1.0.0
The APQC is a useful source of information for finding ways of using the PCF. They are also a major source for information on benchmarking. The APQC explain on their website that:
APQC offers a wide range of assessments and surveys to help you understand your current situation so you can set baselines and goals for improvement initiatives. With APQC’s benchmarking assessments you can compare your performance on more than 5,600 measures against organizations worldwide in nearly every industry. Benchmarking helps organizations to improve by giving them the information they need to effectively identify breakthrough levels of performance and the business processes which drive them.
The APQC list the benefits of using APQC Benchmarking:
- Unbiased, expert Advice: The APQC is non-profit, research-based organization. Our aim is to enhance business productivity by providing accurate, reliable research and data.
- The world’s largest database of Benchmarks and Best Practice: APQC’s benchmarking tools are powered by an Open Standards database of more than 3,500,000 data points, provided by organizations from around the globe.
- Information you can trust: APQC’s data analysts run each data point through a rigorous, multi-step validation process that includes logical and statistical tests prior to adding it to our database.
APQC explains their Open Standards Benchmarking or Rapid Performance Assessments can be used to compare and measure an organization’s against other organizations. This is only possible, because the process metrics are built on the foundation of the PCF.


